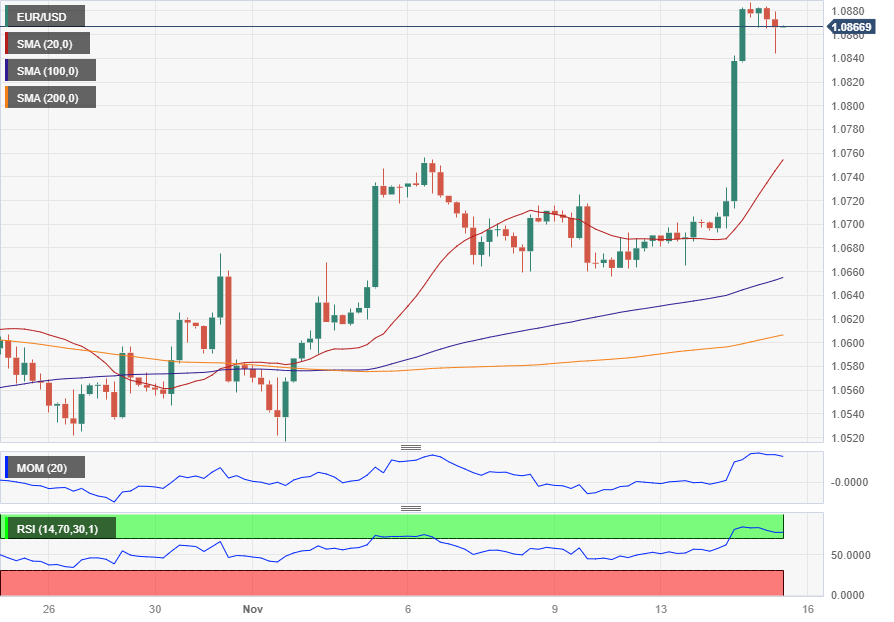
EUR/USD Current Price: 1.0866
- The US Dollar collapsed after US inflation figures indicated no more rate hikes.
- Demand for high-yielding assets underpins the Euro despite mixed local data.
- EUR/USD consolidates gains, aims to extend US inflation-inspired rally.

The EUR/USD pair hit 1.0886, its highest since late in August on Tuesday, as demand for the US Dollar collapsed following softer-than-anticipated United States (US) inflation figures. The country reported that the annual Consumer Price Index (CPI) remained stable on a monthly basis and rose by 3.2% on a yearly basis. The core annual figure posted 4%, decreasing from the previous 4.1%. All reported figures were slightly below the previous month’s ones, indicating price pressures continued to recede.
Market players rushed to bet against additional Federal Reserve (Fed) rate hikes, moving into high-yielding assets and triggering the USD sell-off. At the same time, Wall Street posted substantial gains, with stocks’ positive momentum extending into the following sessions. Meanwhile, government bond yields held at the lower end of their latest range, with the 10-year Treasury note currently yielding 4.45% and the 2-year note offering 4.85%.
Data-wise, Germany released the October Wholesale Price Index, which contracted by 0.7% MoM and 4.2% from a year earlier. On a negative note, Euro Zone Industrial Production contracted 1.1% MoM in September while falling 6.9% from a year earlier. Finally, the EU seasonally adjusted Trade Balance posted a surplus of €9.2 billion in the same month, recovering from a deficit of €11.1 billion in August.
The US released MBA Mortgage Applications for the week ended November 10, which were up by 2.8%. Later in the day, the country will publish the October Producer Price Index (PPI) and October Retail Sales, foreseen down in the month by 0.3%.
EUR/USD short-term technical outlook
The EUR/USD pair spent the first half of the day consolidating gains and meeting buyers around 1.0840, the immediate support area. From a technical point of view, the risk skews to the upside according to the daily chart. The pair comfortably develops above its 100 and 200 Simple Moving Averages (SMAs) for the first time in over two months, while the 20 SMA accelerated higher, still below the longer ones. Technical indicators, in the meantime, have lost their positive momentum but hold near overbought readings, falling short of suggesting upward exhaustion.
Bulls retain control of EUR/USD in the near term. The 4-hour chart shows that technical indicators retreated from extreme levels but remain within overbought territory, picking up ahead of Wall Street´s opening. At the same time, the 20 SMA heads firmly north, far below the current level, while the longer ones gain upward traction below it. The pair has room to extend gains once above the aforementioned high, with speculative interest now looking for a potential test of the 1.1000 threshold.
Support levels: 1.0840 1.0800 1.0755
Resistance levels: 1.0890 1.0925 1.0960