EUR/USD Current Price: 1.0690
- The US Dollar started the week losing ground, although EUR/USD remains below 1.0700.
- The US Consumer Price Index and the Euro Zone Gross Domestic Product stand out this week.
- EUR/USD offers a neutral stance in the near term, the risk skews to the upside.
The EUR/USD pair trades with modest gains at the beginning of the new week, still struggling to extend gains beyond the 1.0700 mark. The US Dollar weakened against most major rivals, although it reached a fresh yearly high against the Japanese Yen, with USD/JPY hitting 151.78 and trading nearby. Other than that, major pairs develop within familiar levels, still waiting for a catalyst.
Meanwhile, stock markets trade with a sour tone. Asian shares fell, although European ones post modest gains. Government bond yields, in the meantime, trade with modest gains, overall stable.
The macroeconomic calendar will be pretty light on Monday, but first-tier figures are scheduled for later in the week. The United States (US) will release the October Consumer Price Index (CPI) on Tuesday, with financial markets anticipating the index at 3.3% YoY, decreasing from the previous 3.7%. Ahead of the announcement, the Euro Zone will publish the second estimate of the Q3 Gross Domestic Product (GDP) expected to be confirmed at -0.1% QoQ.
EUR/USD short-term technical outlook
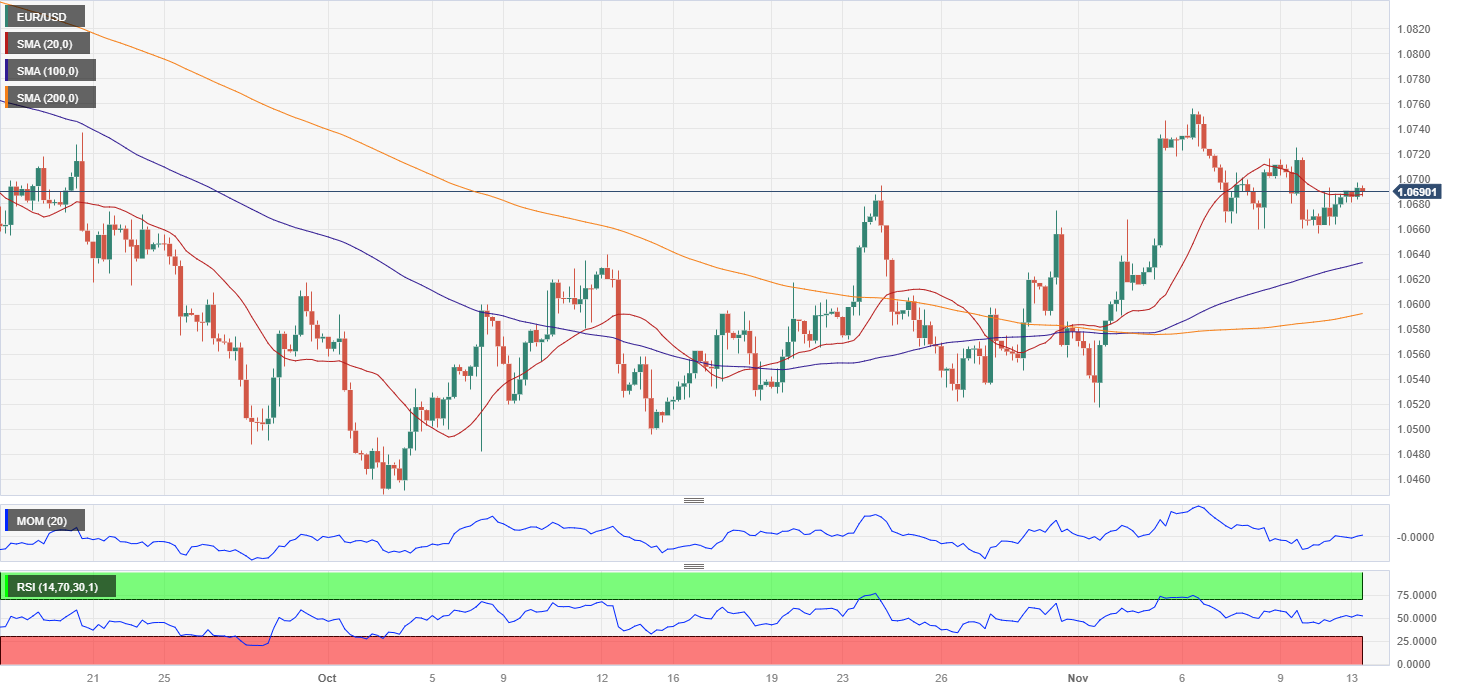
The daily chart for the EUR/USD pair favors an upward extension, although the momentum is limited. The pair develops well above a bullish 20 Simple Moving Average (SMA), currently providing dynamic support at around 1.0625. The 100 and 200 SMAs offer modest downward slopes, converging around the 1.0800 price zone. Finally, the Momentum indicator aims north, firmly bouncing from its midline, while the Relative Strength Index (RSI) indicator consolidates around 56.
In the near term, and according to the 4-hour chart, EUR/USD is neutral. The pair hovers around a flat 20 SMA, although the longer moving averages maintain their upward slopes far below the current level. Technical indicators lack directional strength within neutral levels, with the RSI grinding higher at around 52, skewing the risk to the upside without confirming so.
Support levels: 1.0655 1.0620 1.0590
Resistance levels: 1.0710 1.0760 1.0800